
Success Dashboard
by Joshua Rosales
The El Camino College and Compton College Success and Retention reports have a new look. We are keeping the old PDF links for the Division level and instructor level reports. However, we are adding a new tool that will allow users more dynamic control of Success rates being viewed. You can look at current term outcomes, as well as the four-year trend by Division, Department, Course, and Instructional Method. You can also view outcomes for demographic groups by Race/Ethnicity, Gender, and Age Group. You can also select a combination of these categories to better drill into the data.
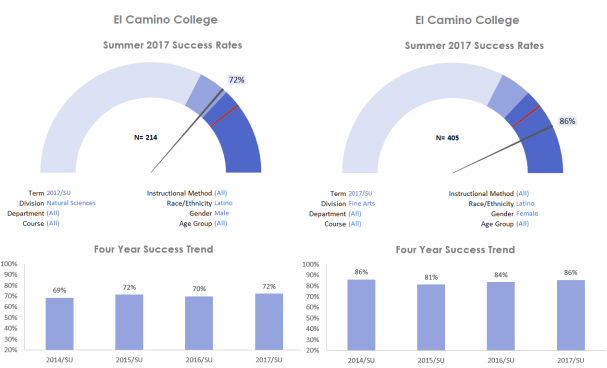
The new dashboard is divided by color into 3 regions. There is the region below our stated institutional standard. This is the minimum percentage we want to see our success rates fall as an institution. The next region is the range between the institution standard and the college’s goal. The final region surpasses the college goal. There is also a marker indicating the institutional Success Rate for the term.
In the examples below, the institutional Success Rate for the Summer 2017 term was above the college goal. This is not uncommon for Winter and Summer terms, whereas Fall and Spring typically have success rates below the college goal. On the left, male Latino students in Natural Sciences courses have a success rate of 72%, just below the college goal. On the right, Latino females in Fine Arts courses have an average success rate well above the college average and the college goal. We have also added the four-year trend of like terms (summer to summer, fall to fall, etc.) to compare the group’s outcomes over time.
Give these new tools a test drive. We think it will help highlight the college’s successes as well as give a better focus on the scope and magnitude of any areas of concern.
Degree and Certificates and Time to Completion Reports
by Joshua Rosales
ECC Institutional Research and Planning has released the 2017 Degrees and Certificates reports, as well as the Time to Completion reports for El Camino College and Compton College.
The Degree and Certificate reports highlight award trends for each institution during the 2012-13 to 2016-17 school years. Both Colleges oversaw a growth of degrees conferred during the 2016-17 school year. El Camino grew in both degrees and certificates for the second straight year, after seeing two years of declining awards. Compton has seen 3 years of degree increases, with a 27% growth in the most recent year. Compton also saw its certificates conferred double over the last two years.


A sizeable portion of the degree growth can be attributed to the Associate Degrees for Transfer (AD-T’s). El Camino had an increase of 187 AD-T’s in the last year. Similarly, Compton saw a 77 AD-T gain, which was 20% of all degrees granted the prior year.
Half of all first-time degree and certificate recipients in 2016-17 were able to complete their programs within four years or less. Few graduates were able to complete their programs within 2 years, which is the amount of time typically associated with Community College. Two-year degree completion rates were 6% for El Camino and 7% for Compton. Slightly higher percentages of certificate recipients were able to complete within two years.


Survey of Entering Student Engagement (SENSE) Results are IN!
by Mark Katayama
For community colleges, student engagement comprises many of the programs, services, and staffing targeted at making students successful. Survey of Entering Student Engagement (SENSE) helps community and technical colleges focus on the “front door:” of the college experience. Grounded in research about what works in retaining and supporting entering students, the SENSE survey collects and analyzes data about institutional practices and student behaviors in the earliest weeks of college.
Both El Camino College and the El Camino College Compton Center participated in the SENSE survey in Fall 2016 and the results showed overall improvement in most categories. Here are two highlights, one from each campus:
At El Camino College, academic plans and pathways improved across the categories targeting student interactions with academic advisors. Specifically, almost three-quarters of students felt advisors helped identify courses they needed to enroll in for their first semester. Additionally, an area of weakness in 2014 was advisors helping to set academic goals, in 2016 that aspect improved to over half of the students feeling they were guided in developing academic goals and creating a plan to achieve them.

At El Camino College Compton Center, two benchmark scores improved and surpassed the SENSE national average. Students entering with high expectations and aspirations showed over half of students felt faculty wanted them to succeed. Additionally, students felt their skills developed and honed within the first three weeks of the semester to obtain their academic and career goals by the campus.

The SENSE reports and highlights for each campus are available on the Institutional Research & Planning Survey Page.
IRP representatives are happy to present and discuss these results at any division or department meeting on campus. Please contact eccresearch@elcamino.edu to schedule a presentation.
2017 Student Success Scorecard
by Marci Myers
It is that time of year again…the 2017 Student Success Scorecard is here!
Released in March 2017, the Student Success Scorecard is annually reported by the Chancellor’s Office. The Scorecard data is available for each community college to inform how well colleges are doing in remedial instruction, job training programs, retention of students and graduation and completion rates.
Here are some highlights:
- 71% of El Camino College students and 86% of Compton Center students from the most recent Scorecard cohort were unprepared for college.


- Two new measures have been added to the Scorecard this year:
- Transfer Level Achievement – Percentage of first-time students at ECC who complete six units and attempt any Math or English in their first year who complete a transfer-level course in Math or English in their first or second year.
- Skills Builder – The median percentage change in wages for students who completed higher level CTE coursework in cohort year and left the system without receiving any type of traditional outcome such as completion of a degree, certificate, or transfer.
- El Camino College and Compton Center showed improvement in most Scorecard measures as seen in the Scorecard Trends reports on our website:
All 113 community colleges’ Scorecards can be found on the CCCCO website.
2017 Academic Performance Profiles (Peer Institution Reports)
By Joshua Meadors
The 2017 Academic Performance Profiles (a.k.a. Peer Institution Reports) are now available for both El Camino College and Compton Center. You can access them from the following links:
El Camino College – 2017 Academic Performance Profile
El Camino College Compton Center – 2017 Academic Performance Profile
These reports are based on data from IPEDS. We generally caution against making direct institutional comparisons because every college and community is different, with unique challenges, goals, and influential factors. However, these reports are particularly useful for improving accountability and examining trends across a group of institutions that share similar characteristics like size, student demographics, and geographical location. More detailed summaries of these reports are provided below. (more…)
Success and Retention Reports Online
by Joshua Rosales
Fall 2016 Success and Retention reports are up. Each term, after grades have been submitted to the Chancellor’s Office, Institutional Research and Planning produces these standard reports which allow people to view outcomes at El Camino College and the El Camino College Compton Center. You can view these outcomes by Division, Department, Course, and even by Instructor.
Before I proceed, let’s define Success and Retention. These terms are rates defined by the CCC Chancellor’s Office based on grades received. The denominator for both terms are all grades of A, B, C, D, F, Pass, No Pass, Incomplete, and Withdraw. The numerator for Success includes all students who earn an A, B, C, or Pass. The numerator for Retention includes all students who stay in the class until the end of the term- so all of the previously mentioned grades except “W”. So a student who receives a D grade in a course is not counted as Successful but is counted as Retained.
Outcomes by age group, gender, and ethnicity are also available internally through MyECC. You can download the Excel files for each term by logging into MyECC. Under the “Areas” tab go to “Institutional Effectiveness” and then “Institutional Research and Planning” to access the files. If you need help, contact the IRP office.
The next upload will occur during the summer after Spring ‘17 grades have been submitted. That upload will include Winter ’17 and Spring ’17 since both of those terms get submitted to the Chancellor’s Office at the same time.
Compton Center – Research Brown Bag Digest – February 2017
For February’s Research Brown Bag, we’ve moved in a slightly different direction than our previous sessions. Beginning with the February meeting, we’re focusing on using these brown bags to share the best practices in conducting educational research. One goal of the Research Brown Bags is to improve everyone’s ability to access and understand data, and we believe a better understanding of how research is generally conducted can help with this.
We started this new series with a discussion of how to create research questions. A research question is simply just the major question that guides a research project. There really isn’t a fancy definition, but creating good research questions is always an important first step to conducting good research.
In a more practical sense, understanding and being able to create research questions will help anytime your program or department needs to evaluate something. Good research questions can make SAO evaluations easier because you can make sure you design questions that give you exactly the kind of data you need for making an assessment. Understanding how to design research questions also helps when you need to design other questions (e.g., for surveys).
For more information and a detailed summary of the last Research Brown Bag, read the full post below. (more…)
2015-16 Student Success and Equity Gaps
by Beth Katz
Recently, Institutional Research and Planning conducted an analysis of student performance in the 2015-2016 academic year. Jean Shankweiler, El Camino College’s (ECC) Vice President of Academic Affairs, and Barbara Perez, Vice President of the ECC Compton Center, shared this data with faculty and staff at the Spring 2017 Flex Days.
This post summarizes the performance of ECC students and progress toward meeting campus-wide goals for student success, and highlights equity gaps between the various ethnic groups.
How did ECC students do in the 2015-2016 academic year? The overall course success rate was 68%. What does that mean? Of the 124,281 course enrollments, 84,624 resulted in passing grades (A, B, C, or Pass). The remaining enrollments were divided between failing grades and course withdrawals.
How does this compare to previous years? The success rate was essentially unchanged when compared to the previous year. In fact, the success rate has varied between 69% and 70% since the 2010-2011 academic year.
Where do we want to be? ECC has an ACCJC Institution-Set Standard of 65% for its student success rate and an Institutional Effectiveness Outcome goal of 73.7% by the year 2019-2020. While we have consistently met the standard, we have not yet met our goal.
How did the different ethnic groups perform? The success rate varied greatly across the different ethnic groups. Only two student groups exceeded the success rate goal: White students (78%) and Asian students (79%). Three groups met the standard of 65%, but not the goal: students categorized as “Unknown or Decline” (71%), “Two or More” ethnicities (69%), and Latino (65%). The remaining three groups performed below the goal and the standard: Pacific Islander (63%), American Indian/Alaska Native (61%), and African American students (57%).
What would it take to meet our goal? Campus-wide, nearly 7,000 additional passing grades would have been needed to increase the overall success rate from 68% to 73.7%. That means converting nearly one out of every five failing grades or withdrawals into passing grades.
What would it take to get all ethnic groups to meet that same goal? An additional 5,469 passing grades would have been needed to increase the success rate for Latino students from 65% to 73.7%. In other words, one out of every four failing grades or withdrawals received by a Latino student would have needed to be a passing grade. The challenge is steeper for African American students. An additional 2,744 passing grades would have been needed to increase the success rate for African American students from 57% to 73.7%. That would have meant converting nearly 4 out of every 10 failing grades or withdrawals received by African Americans into passing grades. Further, African American students would have needed an additional 1,282 passing grades just to meet the standard of 65%.
How do we get there? Many campus initiatives are working to close these equity gaps by providing support to disproportionately impacted student groups, as well as the general student population. Where will get the 7,000 additional passing grades that we need? While it is important to help all student groups improve, given the composition of ECC’s student body, the college will not be able to meet its overall success rate goal of 73.7% without improving the performance of significant numbers of Latino and African American students.
Ethnic Diversity at ECC – How Do We Know Who We Are?
by Beth Katz
“Student equity” is a hot topic at ECC and throughout California’s community colleges. As we work to identify populations of students who are disproportionately impacted and in need of additional support, we first must understand the characteristics of the students we serve.
The California Community Colleges Chancellor’s Office (CCCCO) requires ECC to report data on student race and ethnicity, using categories defined by the U.S. Census Bureau. According to the Census, “Hispanic/Latino” is an “ethnicity,” and not a “race.” A person of any race (White, Black, American Indian, etc.) can also identify as Latino. ECC collects data on student identification with 21 different ethnic subgroups when students complete their initial applications. Using that data, the CCCCO then classifies students into eight mutually exclusive “ethnic” groups, which are commonly used in equity research:
- African American
- American Indian/Alaska Native
- Asian
- Latino
- Pacific Islander
- Two or More
- White
- Undecided/Unknown
However, we know that some of these groups can be further broken down into more than one racial or ethnic subgroup. Any student who identifies as Hispanic/Latino or with a Hispanic/Latino sub-group (Mexican, Central American, South American, or Hispanic-Other) is automatically labeled as “Latino,” regardless of whether or not they identified with other non-Latino subgroups. In other words, the Latino category trumps all others. This means that the Latino category includes students who identify with two or more ethnic subgroups, and the “Two or More” category does not include any students who identify with Latino subgroups. For example, a student who self-identifies as African American and Mexican is categorized as “Latino.” On the other hand, a student who self-identifies as African American and White is categorized as “Two or More.” (Is your head spinning yet?)
The image below diagrams how the information students submit on their ECC applications gets translated into the eight CCCCO ethnic groups.

What does this mean for equity research? We found that the eight ethnic categories generally used to group students may be concealing some greater diversity. Having a broader perspective on ethnic diversity may be particularly relevant to various student outreach efforts. Because a student’s affiliation with an Hispanic/Latino group obscures associations they may have with other ethnic groups, we may be overlooking students who could be targeted for group-specific programs. For example, a program targeting African American students in Fall 2014 may have overlooked the 825 students who identified as African American and at least one other ethnic subgroup. By ignoring the subgroup classification, we would have underestimated the number of African American students. There is also significant diversity within the Asian and Pacific Islander categories. Therefore, efforts to reach out to different students may be more successful if particular Asian subgroups are targeted, rather than all students who assume the broader label of “Asian.”
Student equity outreach efforts will always rely on students to self-identify and express interest in participating in particular programs; however, this subgroup analysis helps us size up the entire population of students being targeted and could potentially be used to improve the services we provide to various student groups.
Follow this link to read our full report on ECC Student Ethnic Groups.
Assessment Test Results Reports
by Marci Myers
The Assessment Test Results reports have been updated and are now available on our website! These reports display assessment test placements for first-time/full-time students entering El Camino College (ECC) and Compton Center in fall 2014, fall 2015, and fall 2016. Results were also disaggregated by gender and race/ethnicity to examine possible signs of disproportionate impact.
Here are some of the interesting findings from these reports:
- In the past three years there has been a decrease in the number of assessment tests taken on-campus and an increase in the number of assessment tests taken off-campus.
- The results illustrate the variations in transfer-level placement rates in reading, writing, and mathematics as seen in the charts below:


The full reports can be found on our website:

